Calculation of sigma squared
CalcS2.RdCalculation of sigma squared using either residual or simple variance for level, difference or ratio statistics. The function includes options for averaging over several periods.
Arguments
- data
The dataset
- yVar
The variable name for the interest variable (y). Eg "turnover"
- xVar
The name of the activity variable which relates to the interest variable. Eg "numberOfEmployees"
- strataVar
The variable used for stratification
- sampleVar
The variable used to identify which companies were included in the sample. This is used in cases where the interest variable (y variable) are not available for the population. When a variable is specified here, y-values from the sample only are used to calculate s2. Default is NULL
- residVariance
Whether to calculate residual or other variance. Default is residual.
- baseVar
Variable which provides values as a fixed base for difference and ratio statistics. If this is missing, then a moving base is used as the previous period.
- estimateType
The type of statistic being calculated. Choose beteen "level" for a standard level statistic, "diff" for a difference statistic, or "ratio" = ratio statistic. If not provided, the function defaults to a level statistic.
- meanType
In the case of several periods of data, meanType specifies how they should be averaged. Default "var" calculated sigma sq and takes the average. "y" takes the average of the y values first and then calculates sigma sq.
- p
Specifies how much overlap there is between periods for a difference or ratio statistic. Default is p = 1 which indicates full overlap between periods.
- printPlot
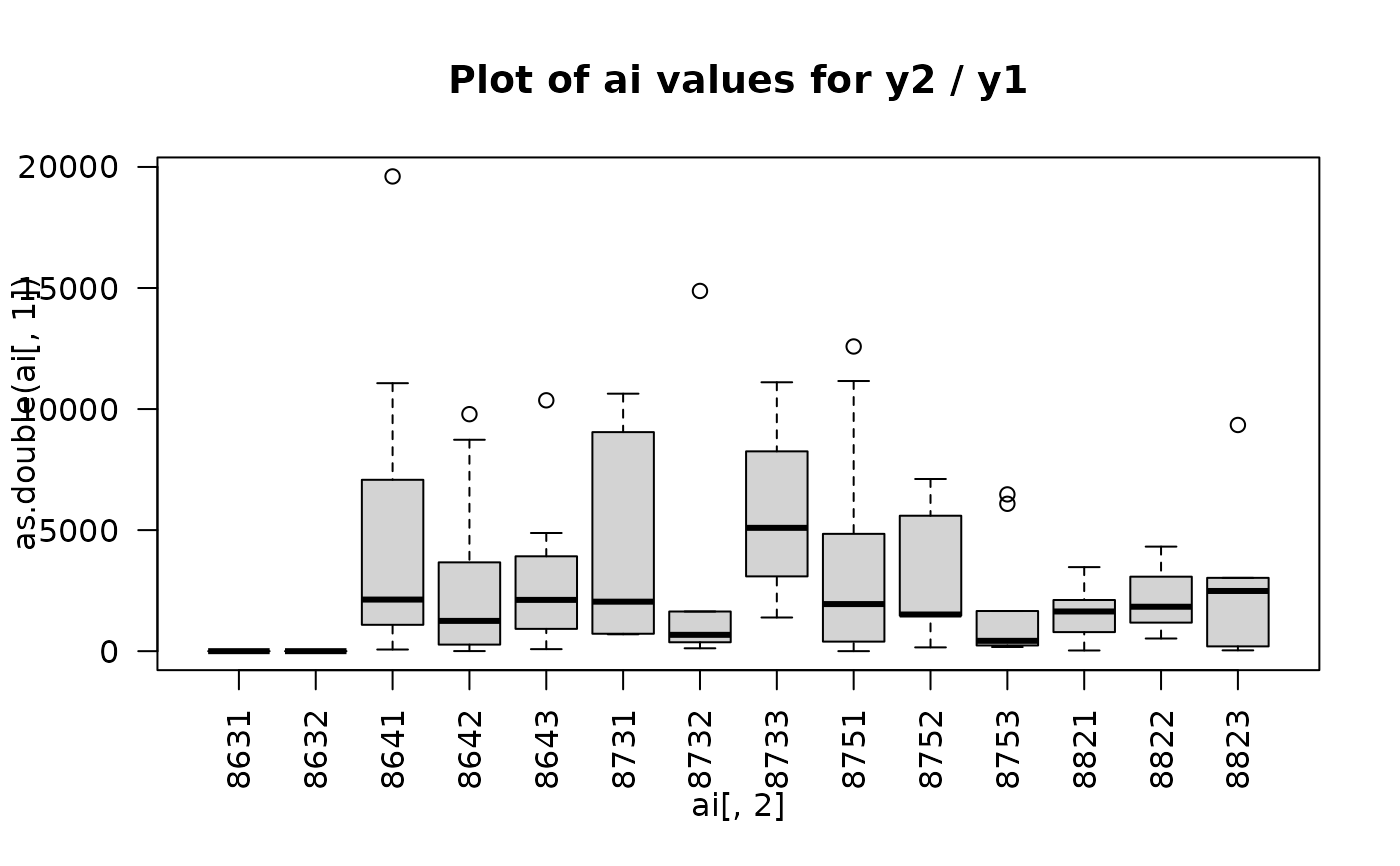
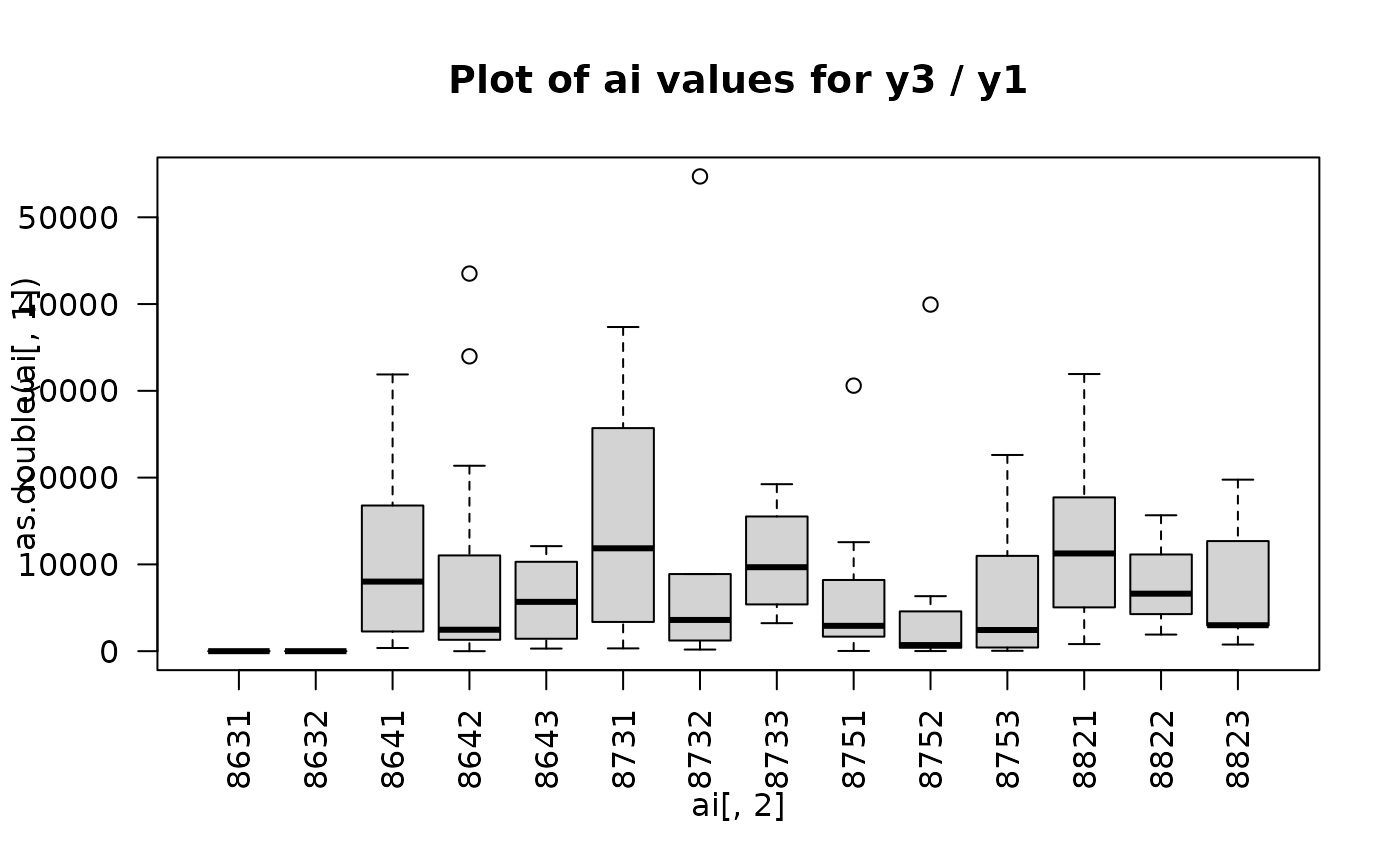
Indicates whether or not to print boxplots of the residual values (ei or ai) to identify outliers. One plot is made for each period or each difference/ratio period. Default is FALSE.
Value
- s2
sigma squred values for each strata group
- N
number of observations used in the calculations.
- n
If a sample variable is specified, n is also returned
Examples
# Call test dataset
  data(testData)

# Create stratification variable
  testData$strata1 <- paste(testData$nace3, testData$storGrp, sep="")

# Resdiual variance for one period
  CalcS2(data = testData, yVar = "y1", xVar = "antAnsatt", strataVar = "strata1",
  estimateType = "level")
#> Warning: The following strata had an s2 that was unable to be calculated or was calculated as 0: 8631
#> The following strata had an s2 that was unable to be calculated or was calculated as 0: 8632
#> $s2
#>       8631       8632       8641       8642       8643       8731       8732
#>          0          0  492346768  404512719  468736662 1921389609  249215604
#>       8733       8751       8752       8753       8821       8822       8823
#>  324825752 1121455763  386863599  692729944  417504746 1360775404  226183872
#>
#> $N
#> 8631 8632 8641 8642 8643 8731 8732 8733 8751 8752 8753 8821 8822 8823
#>    1    1   12   16   10    5    6    4   11    9   10    7    3    5
#>

# Simple variance for one period
  CalcS2(data = testData, yVar = "y1", xVar = "antAnsatt", strataVar = "strata1",
  estimateType = "level", residVariance = FALSE)
#> Warning: The following strata had an s2 that was unable to be calculated or was calculated as 0: 8631
#> The following strata had an s2 that was unable to be calculated or was calculated as 0: 8632
#> $s2
#>       8631       8632       8641       8642       8643       8731       8732
#>          0          0  561660165  417298735  490910441  690015120  151375945
#>       8733       8751       8752       8753       8821       8822       8823
#>  213519846  620529087  318926563  717406349  311907686 1639948453  273038157
#>
#> $N
#> 8631 8632 8641 8642 8643 8731 8732 8733 8751 8752 8753 8821 8822 8823
#>    1    1   12   16   10    5    6    4   11    9   10    7    3    5
#>

# Residual variance for three periods
  CalcS2(data = testData, yVar = c("y1", "y2", "y3"), xVar = "antAnsatt", strataVar = "strata1",
  estimateType = "level")
#> Warning: The following strata had an s2 that was unable to be calculated or was calculated as 0: 8631
#> The following strata had an s2 that was unable to be calculated or was calculated as 0: 8632
#> $s2
#>       8631       8632       8641       8642       8643       8731       8732
#>          0          0  492435964  404149143  468570684 1926515368  250209925
#>       8733       8751       8752       8753       8821       8822       8823
#>  324383053 1121860425  386909528  691670574  419083769 1362964715  226425434
#>
#> $N
#> 8631 8632 8641 8642 8643 8731 8732 8733 8751 8752 8753 8821 8822 8823
#>    1    1   12   16   10    5    6    4   11    9   10    7    3    5
#>

# Include a sample variable
  CalcS2(data = testData, yVar = "y1", xVar = "antAnsatt", strataVar = "strata1",
  sampleVar = "utv1", estimateType = "level")
#> Warning: The following strata had an s2 that was unable to be calculated or was calculated as 0: 8631
#> The following strata had an s2 that was unable to be calculated or was calculated as 0: 8632
#> The following strata had an s2 that was unable to be calculated or was calculated as 0: 8731
#> The following strata had an s2 that was unable to be calculated or was calculated as 0: 8733
#> The following strata had an s2 that was unable to be calculated or was calculated as 0: 8822
#> $s2
#>      8631      8632      8641      8642      8643      8731      8732      8733
#>         0         0 525337551 716445670  56980689         0 417413327         0
#>      8751      8752      8753      8821      8822      8823
#> 394219747  84776358 935850144 668329969         0 246960924
#>
#> $N
#> 8631 8632 8641 8642 8643 8731 8732 8733 8751 8752 8753 8821 8822 8823
#>    1    1   12   16   10    5    6    4   11    9   10    7    3    5
#>
#> $n
#> 8631 8632 8641 8642 8643 8731 8732 8733 8751 8752 8753 8821 8822 8823
#>    0    0    3    3    4    0    4    0    4    3    3    4    0    2
#>

# Difference example - fixed base
  CalcS2(data = testData, yVar = c("y1", "y2", "y3"), xVar = "storGrp", strataVar = "strata1",
  residVariance = TRUE, baseVar = "y1", estimateType = "diff")
#> Warning: The following strata had an s2 that was unable to be calculated or was calculated as 0: 8631
#> The following strata had an s2 that was unable to be calculated or was calculated as 0: 8632
#> $s2
#>      8631      8632      8641      8642      8643      8731      8732      8733
#>         0         0  26462914 100115476  37001939  27401585  74699134 148460252
#>      8751      8752      8753      8821      8822      8823
#>  81995071  77418240  43186923  14280010 175348271 146028180
#>
#> $N
#> 8631 8632 8641 8642 8643 8731 8732 8733 8751 8752 8753 8821 8822 8823
#>    1    1   12   16   10    5    6    4   11    9   10    7    3    5
#>

# Difference example - changing base (just leave out baseVar)
  CalcS2(data = testData, yVar = c("y1", "y2", "y3"), xVar = "storGrp", strataVar = "strata1",
  residVariance = TRUE, estimateType = "diff")
#> Warning: The diff method was chosen but no base variable was specifyied. The previous period will be used as a moving base
#> Warning: The following strata had an s2 that was unable to be calculated or was calculated as 0: 8631
#> The following strata had an s2 that was unable to be calculated or was calculated as 0: 8632
#> $s2
#>     8631     8632     8641     8642     8643     8731     8732     8733
#>        0        0 19043162 18236366 20333359 10585380 10751089 33663412
#>     8751     8752     8753     8821     8822     8823
#> 25839252 24938222 12223588 13270894 20983273 30379507
#>
#> $N
#> 8631 8632 8641 8642 8643 8731 8732 8733 8751 8752 8753 8821 8822 8823
#>    1    1   12   16   10    5    6    4   11    9   10    7    3    5
#>

#Ratio example showing boxplots - fixed base
  CalcS2(data = testData, yVar = c("y1", "y2","y3"),  xVar = "antAnsatt", strataVar = "strata1",
  baseVar="y1", estimateType = "ratio", printPlot = TRUE)


#> Warning: The following strata had an s2 that was unable to be calculated or was calculated as 0: 8631
#> The following strata had an s2 that was unable to be calculated or was calculated as 0: 8632
#> $s2
#>      8631      8632      8641      8642      8643      8731      8732      8733
#>         0         0 134293148 136751878  41055492 301025429 332737628 125720901
#>      8751      8752      8753      8821      8822      8823
#>  81962762 114068562  68813149 157030406  78778367  84064841
#>
#> $N
#> 8631 8632 8641 8642 8643 8731 8732 8733 8751 8752 8753 8821 8822 8823
#>    1    1   12   16   10    5    6    4   11    9   10    7    3    5
#>